Skip to content

The evidence

UCLA developed this well water treatment system and operated three systems in different locations in the Salinas Valley. The systems have produced more than 7 million gallons of high-quality drinking water. And the verified cost analysis shows the capital costs are significantly lower than consolidation.
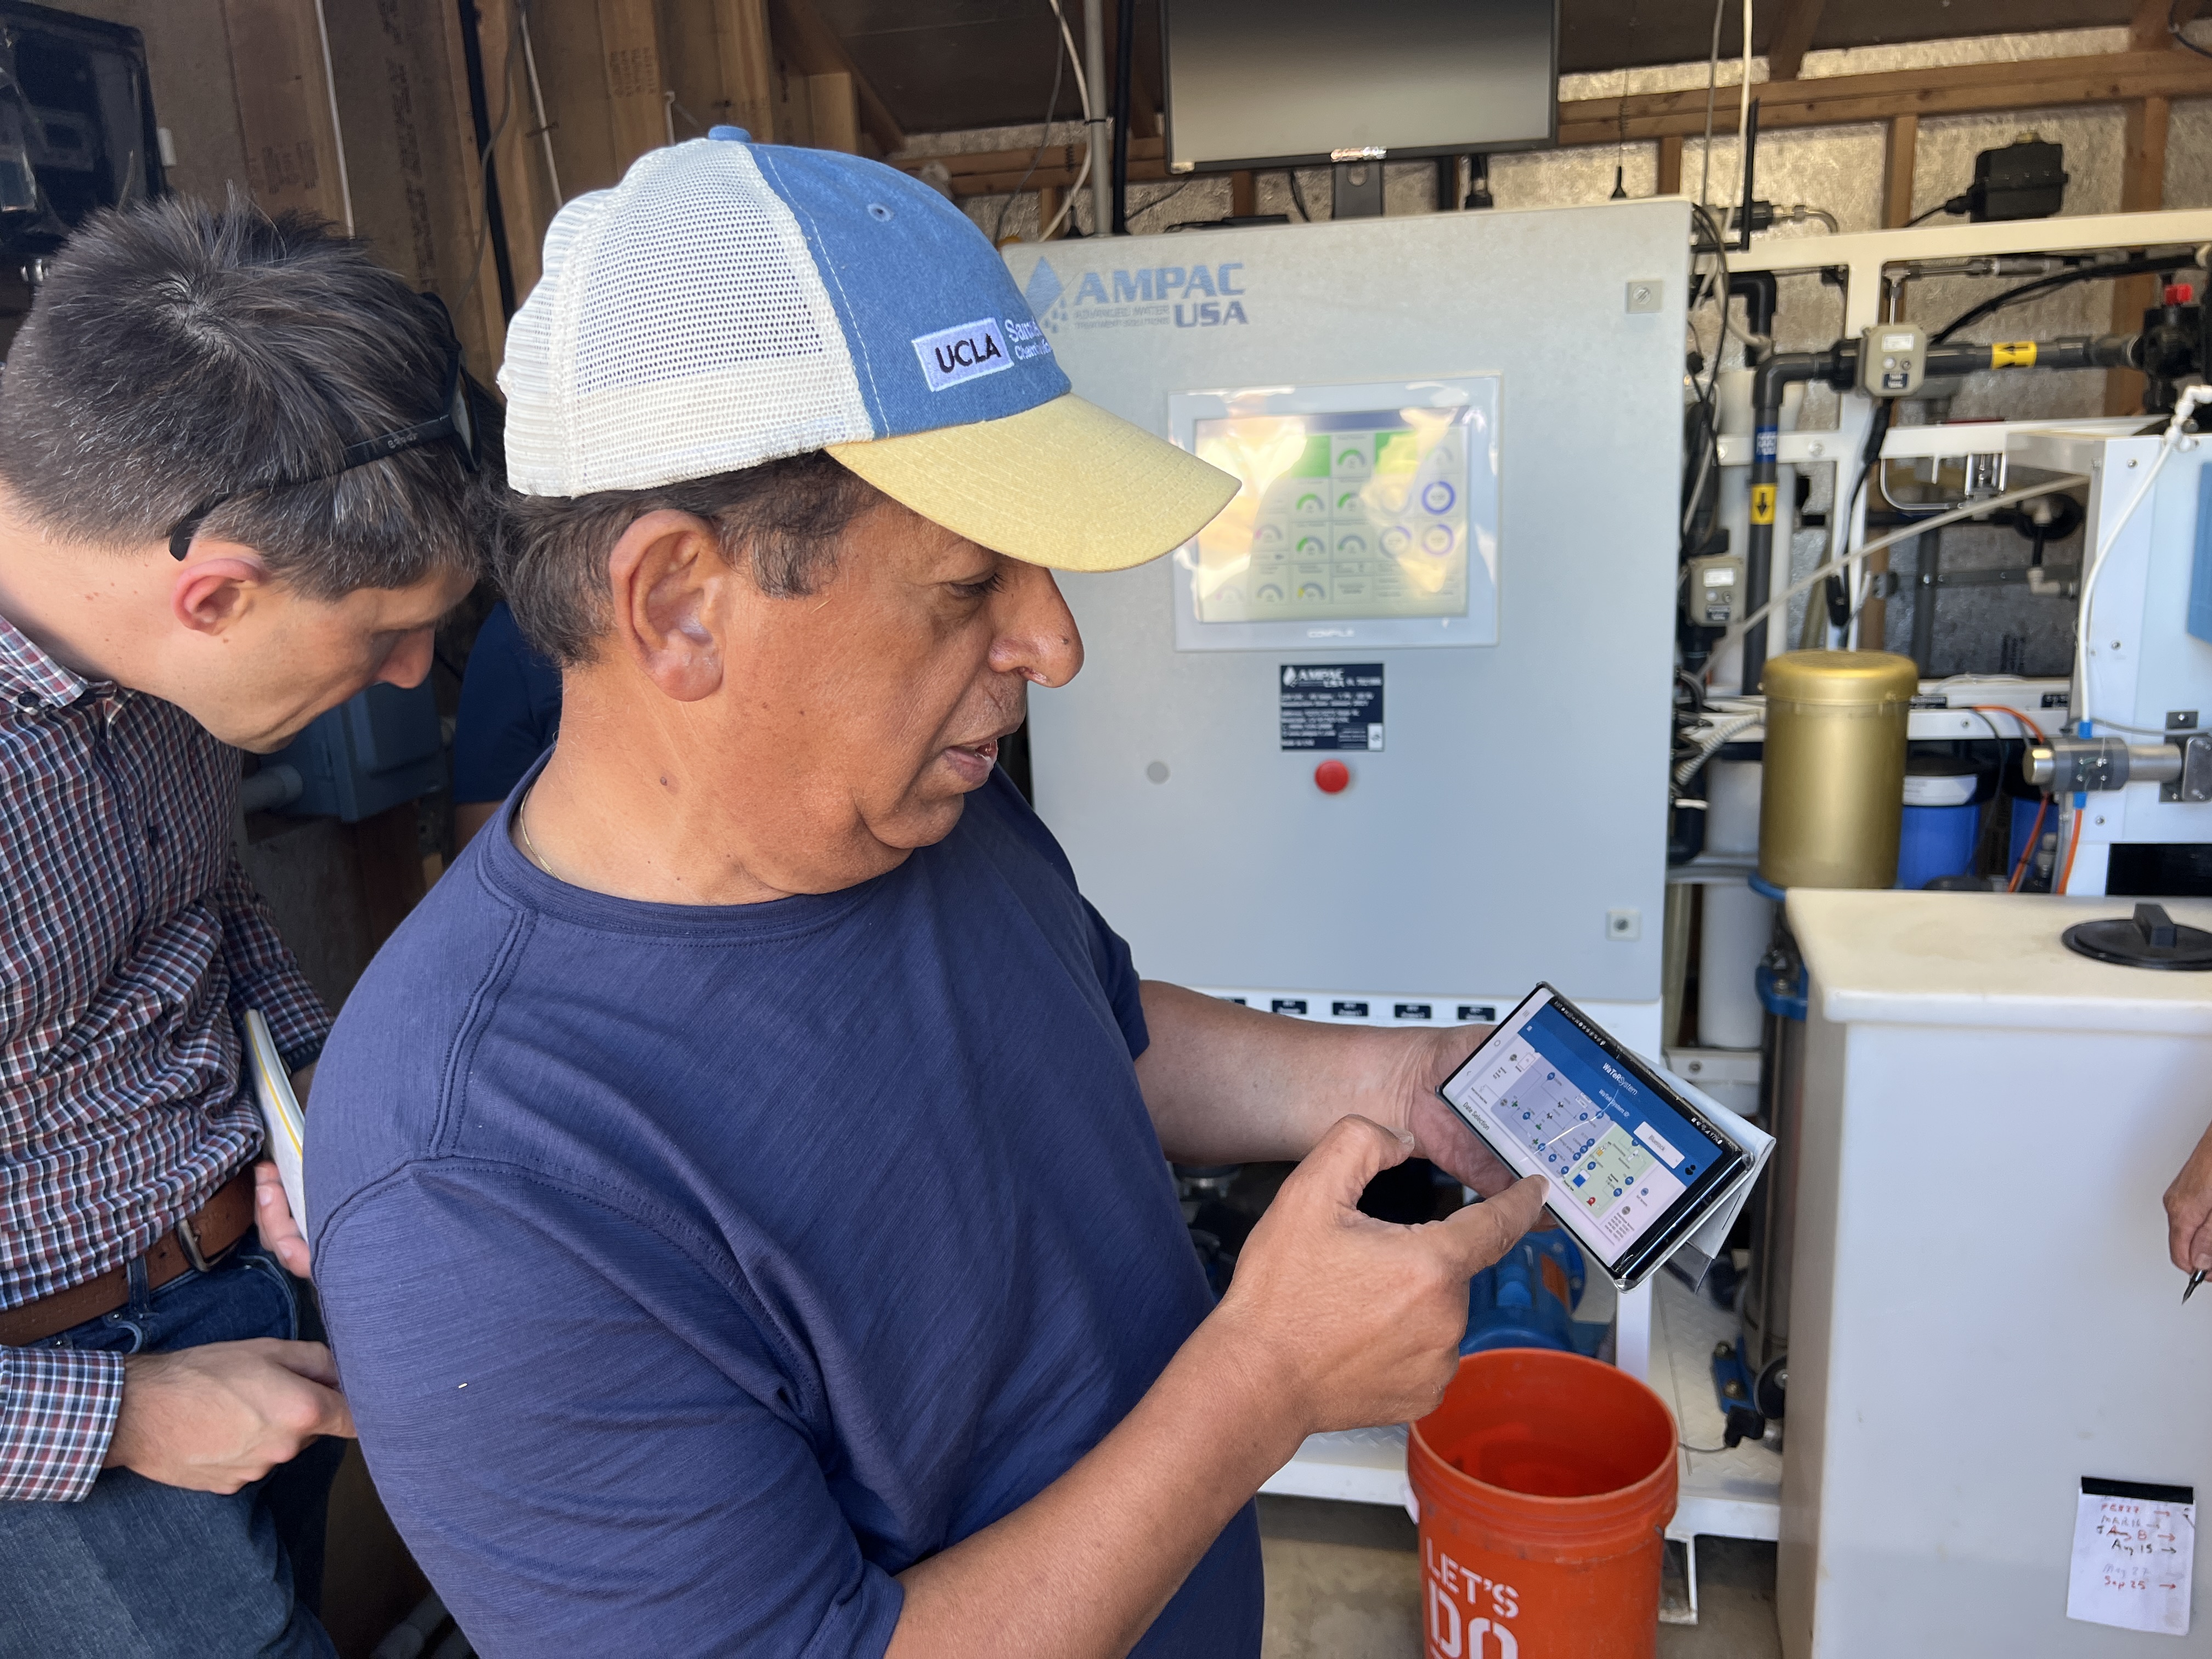
Professor Yoram Cohen of UCLA demonstrating remote monitoring of the system on a tablet, with a colleague looking on
Professor Yoram Cohen of UCLA demonstrating remote monitoring of the system from his phone.

Proven in a UCLA pilot

The first system began operating in 2020, and two more followed in 2022.

The pilot was funded by the California State Water Resources Control Board and the National Alliance for Water Innovation, with regulatory oversight from the County of Monterey Health Department and the Central Coast Regional Water Quality Control Board.

When the pilot ended, the well owners chose to keep the systems running and now pay for their upkeep.
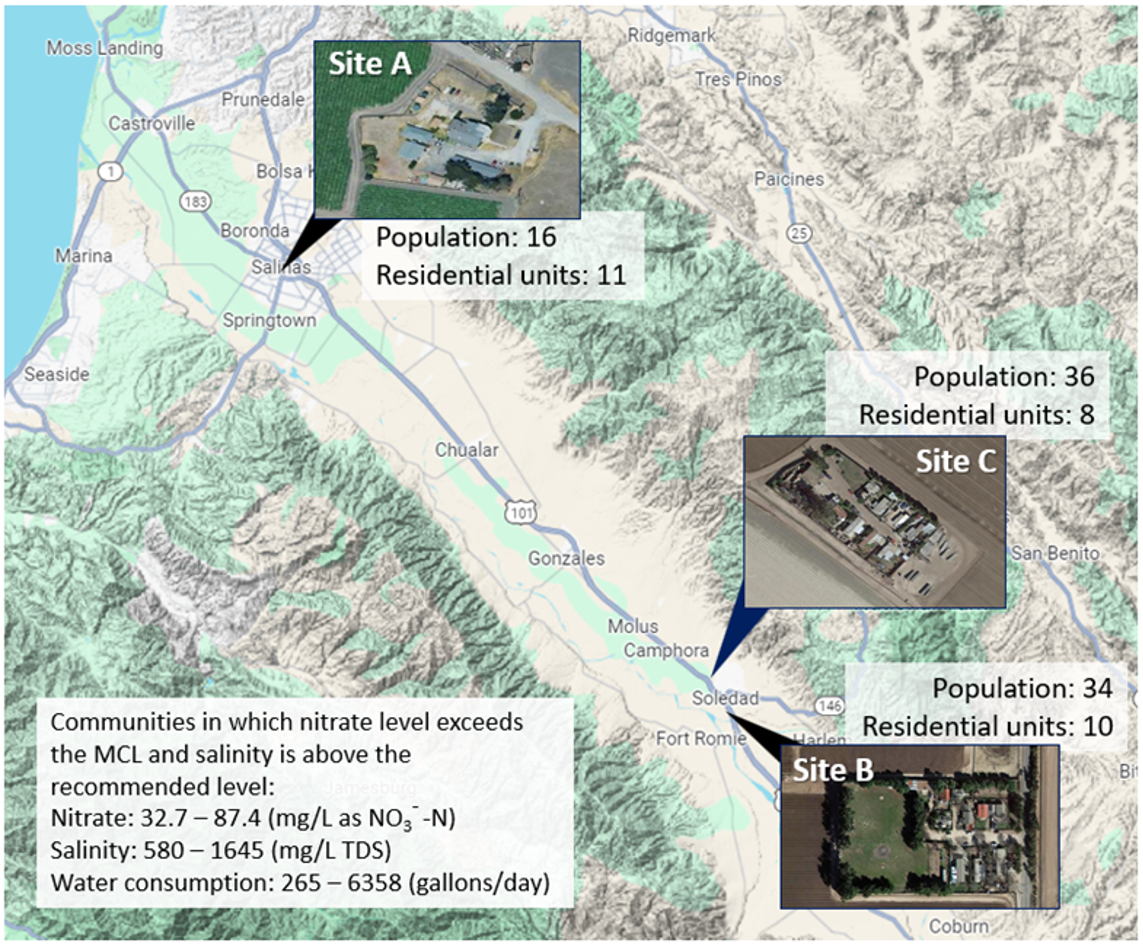
Map of the three pilot sites in the Salinas Valley, each marked with an inset photo and its population and number of residential units
The three pilot sites. Between them, 86 people across 29 residential units. All three communities have nitrate above the legal limit and salinity above the recommended level.

Excellent water quality

Untreated groundwater at the pilot sites had nitrate up to ~9 times the maximum contaminant level, and salinity up to ~3 times the recommended level.

The treated water those systems deliver today is far below both standards, and at some sites lower than nearby municipal supplies.

Nitrate

Nitrate in untreated well water and in the treated water each system delivers

0102030405060708090MaximumContaminantLevel81.1maximum68.7average61.8minimum4.832.870.4812.512.111.52.942.920.9887.473.165.66.33.91.7Source waterTreated waterSite ASource waterTreated waterSite BSource waterTreated waterSite CNitrate (mg/L as N) 0102030405060708090Maximum Contaminant LevelSite ASource water81.1maximum68.7average61.8minimumTreated water4.832.870.48Site BSource water12.512.111.5Treated water2.942.920.98Site CSource water87.473.165.6Treated water6.33.91.7Nitrate (mg/L as N)
Nitrate at each pilot well. The bar is the average of samples; the green line runs from the lowest to the highest reading. The dashed line is the state threshold for safe drinking water - the Maximum Contaminant Level - of 10mg/L. The average nitrate level in the municipal supply from Salinas was 3.2 mg/L between 2022-2024.

Salinity

Total dissolved solids in untreated well water and in the treated water each system delivers

02505007501,0001,2501,5001,750SecondaryMaximumContaminantLevel1,621maximum1,545average1,482minimum1341035778763260614292601,6451,5351,13416110858Source waterTreated waterSite ASource waterTreated waterSite BSource waterTreated waterSite CTotal Dissolved Solids (mg/L) 05001,0001,500Secondary MaximumContaminant LevelSite ASource water1,621maximum1,545average1,482minimumTreated water13410357Site BSource water787632606Treated water1429260Site CSource water1,6451,5351,134Treated water16110858Total Dissolved Solids (mg/L)
Total dissolved solids at each pilot well. The bar is the average of samples; the green line runs from the lowest to the highest reading. The dashed line is the 500 mg/L Secondary Maximum Contaminant Level — a recommended level rather than an enforceable one. For comparison, Salinas municipal water averaged 513 mg/L from 2022 to 2024.

Pilot system costs

A levelized cost analysis by UCLA and Lawrence Berkeley National Laboratory found the pilot systems cost $119,000–$133,000 to build and $2–$2.9/m3 to operate.

Pie chart of the weighted average capital costs across the three pilot systems: water treatment system 51.5%, contractor labor 32.4%, construction and electrical equipment 6.0%, tanks 4.8%, shed 4.0%, cyberinfrastructure 1.3%.
Weighted average of the capital costs across the three pilot systems.
Pie chart of the weighted average operating costs across the three pilot systems: labor 57.8%, energy consumption 27.5%, replacements 6.0%, consumables 5.8%, cyberinfrastructure 3.0%.
Weighted average of the operating costs across the three pilot systems.

The capital costs of the three pilot systems ($119,000-133,000) were far less than the costs the State Water Board modeld as the recommended maximum for consolidations. The 2024 cost assessment for physical consolidation put this at $2 million for communities with 5-14 connections.

Pilot operating costs were in line with centralized supply in the study region ($2–$4/m3) and across California ($2–$6/m3).

Next: WellForward’s costs

WellForward will next demonstrate the real costs of operating at the Virtual Water District scale. There will be new administrative costs to cover under WellForward, but we expect cost reductions through economies of scale in manufacturing, construction, and operations across more systems.

How the system works

The pilot is what the system is built on. How it treats water, and how one operator can run many wells, is on the How it works page.

How the system works